Case study · Research management
Making research progress visible, structured and connected.
Monthly Research Progress Connect (MRPC) brings research progress, activities, project information and monitoring into one centralized digital workspace — from the target a department is set, to the record a faculty member submits, to the report the institution prints.
01 The challenge
Research progress needs more than scattered updates.
A research office runs on a continuous cycle: targets are set, faculty do the work, someone verifies it, and the institution has to be able to answer for all of it. When that cycle lives in documents and mail threads, each stage loses the one before it.
- 01Scattered informationPublications, patents, funding and consultancy records sit with individual faculty in separate files.
- 02Manual follow-upVerifying what has been done means chasing people, not opening a screen.
- 03Limited visibilityA department cannot see how far it is from a target while there is still time to act on it.
- 04Difficult monitoringConsolidating across twelve departments and five faculty cadres is rebuilt by hand every reporting cycle.
02 The solution
One connected workspace for research progress.
MRPC holds the whole cycle in a single system: institutional targets, faculty submissions, review at department level, automatic point calculation, and reports generated from the same verified records. Each capability below is one that exists in the live product.
Target definition
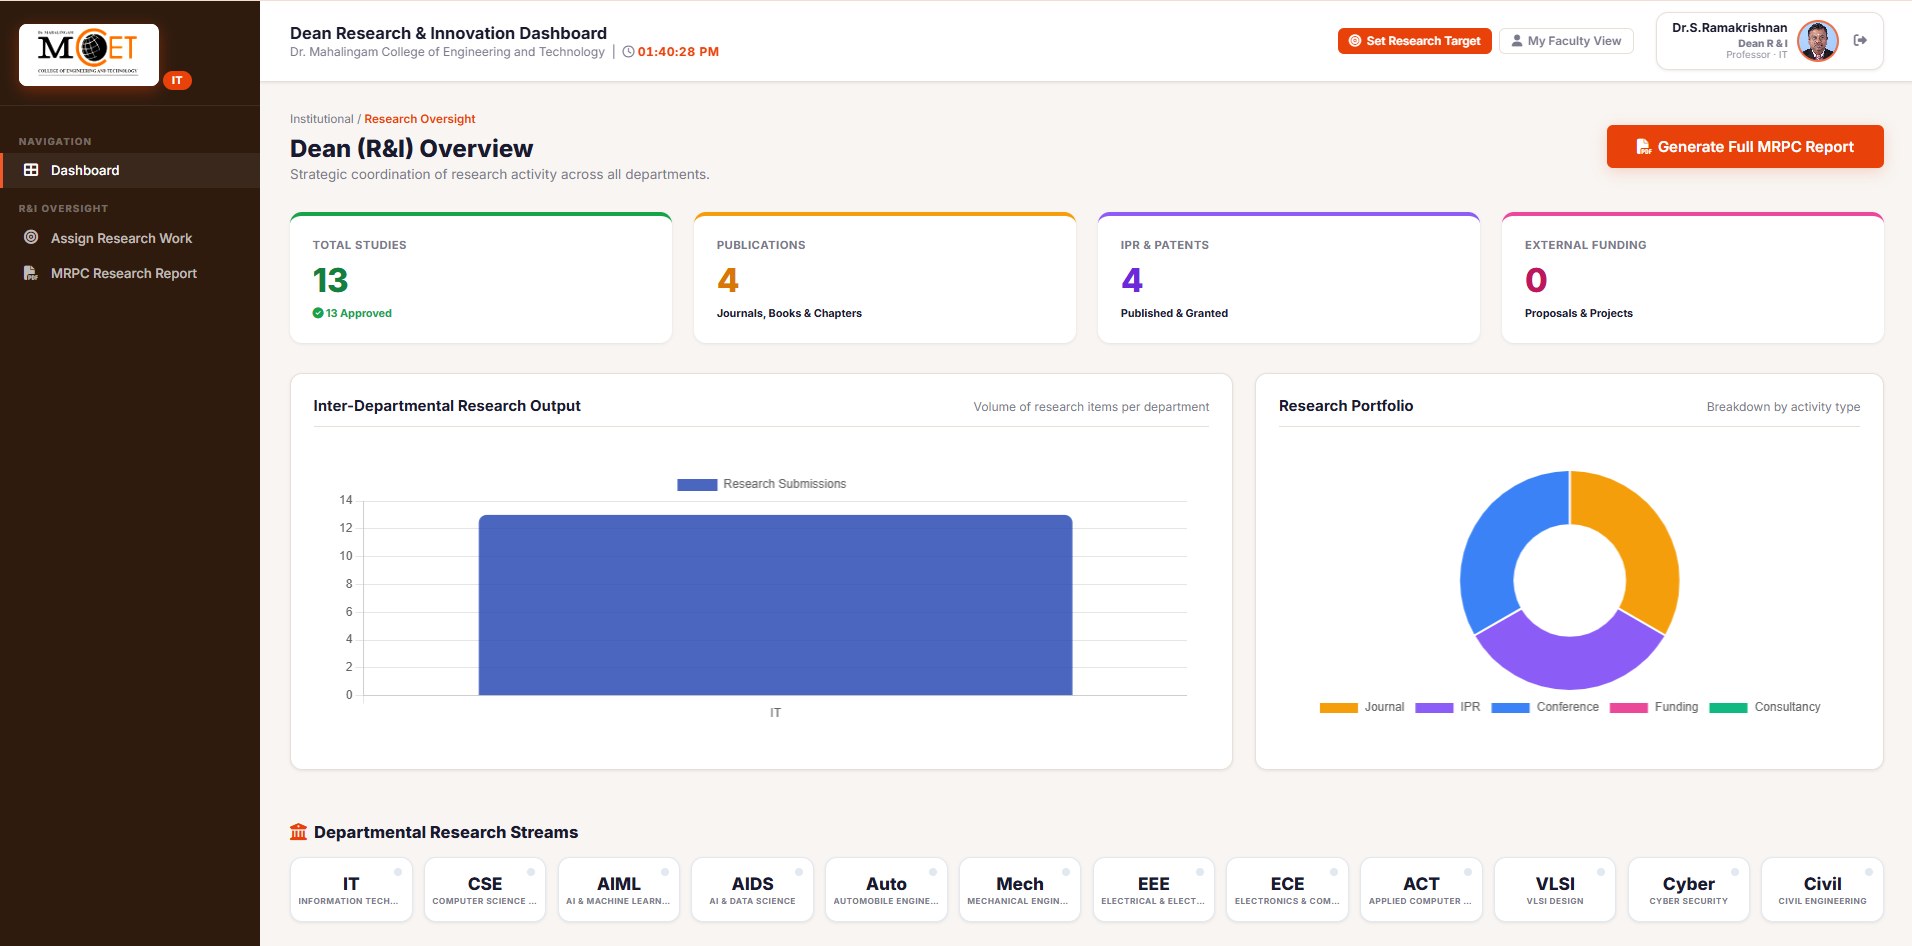
Research targets are set per department, research sheet and academic year, with a target count.
Target assignment
Targets are assigned to a department and on to faculty, across fourteen research work fields.
Activity submission
A three-step record: choose a category, choose the activity sheet, fill the details.
Review & status
Pending, approved and rejected counts per department, with a status carried on every record.
Points matrix
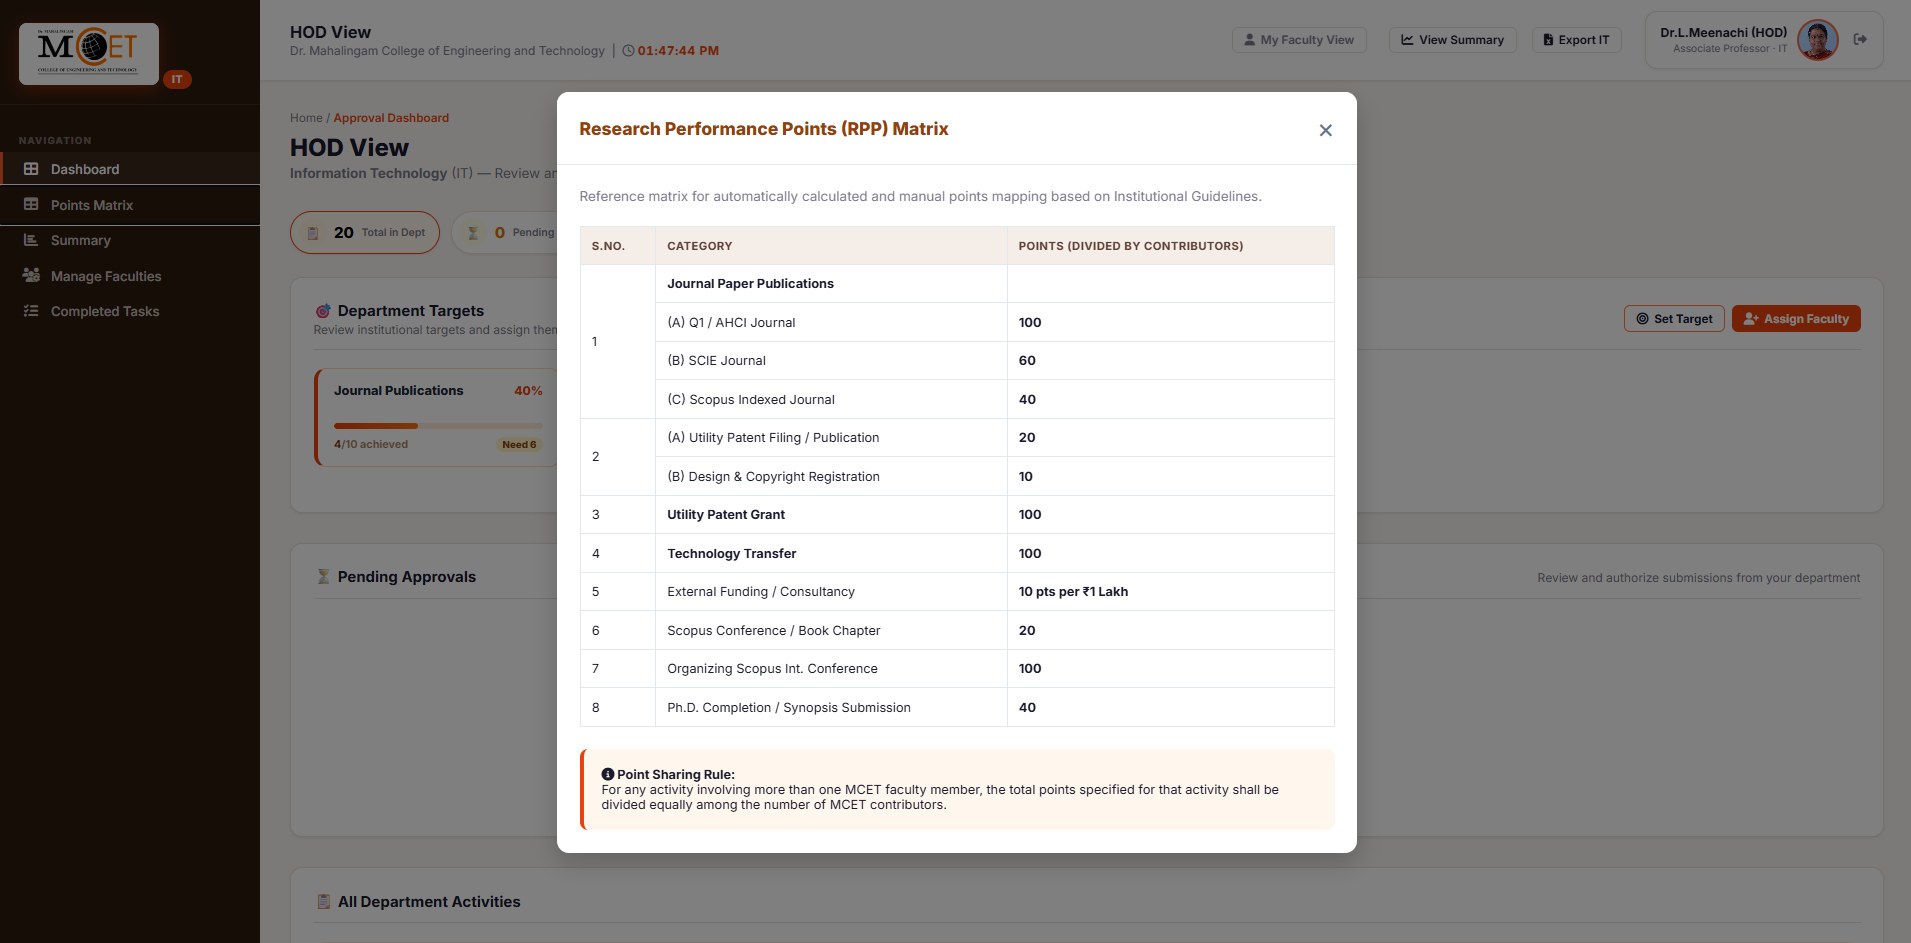
A published RPP matrix maps each activity category to points, shared between contributors.
Department consolidation
Criterion-wise summary across Q1–Q4 with totals, exportable per department.
Faculty progress
An achievement score, target progress and a full submission history per faculty member.
Reports
RI 600 progress report, faculty self-appraisal analysis, and a full institutional MRPC report.
03 Users & roles
Four views of the same record.
The screens show four distinct views — Dean (R&I), HOD, SPOC and Faculty. They are views rather than walled-off products: the Dean's header carries a My Faculty View switch, and switching announces “Switched to FACULTY view” with an Open Dean View control to return.
Dean (R&I)
INSTITUTION
- Sees
- Institution-wide counts, output by department, portfolio by activity type, all twelve departmental streams.
- Manages
- Department research targets and the institutional assignment form.
- Monitors
- Every institutional research submission and its status; generates the full MRPC report.
HOD
DEPARTMENT
- Sees
- Department targets with achieved-versus-needed progress, and all department activities.
- Manages
- Set Target and Assign Faculty; faculty records under Manage Faculties.
- Monitors
- Pending approvals, the consolidation summary by criterion and quarter, and department export.
SPOC
DEPARTMENT · REVIEW
- Sees
- The department approval dashboard: total, pending, approved and rejected.
- Manages
- User management for the department; the points matrix reference.
- Monitors
- Pending approvals and the full list of department activities with status and last update.
Faculty
INDIVIDUAL
- Sees
- My Activity Dashboard — achievement points, submission counts, assigned targets.
- Manages
- New submissions through the three-step activity form.
- Monitors
- Status and remarks on each submission; completed targets; the RI 600 report.
04 MRPC workflow
From a target to institutional visibility.
Seven stages, each one a screen in the live product. Assignment travels down from the institution; a record travels back up through department review and ends as institutional data.
DEAN (R&I)
Target is defined
A research target is created against a department, a research sheet and an academic year, with a target count. The form sits directly on the Dean's dashboard.
05 Dashboard
Start with a complete view of research progress.
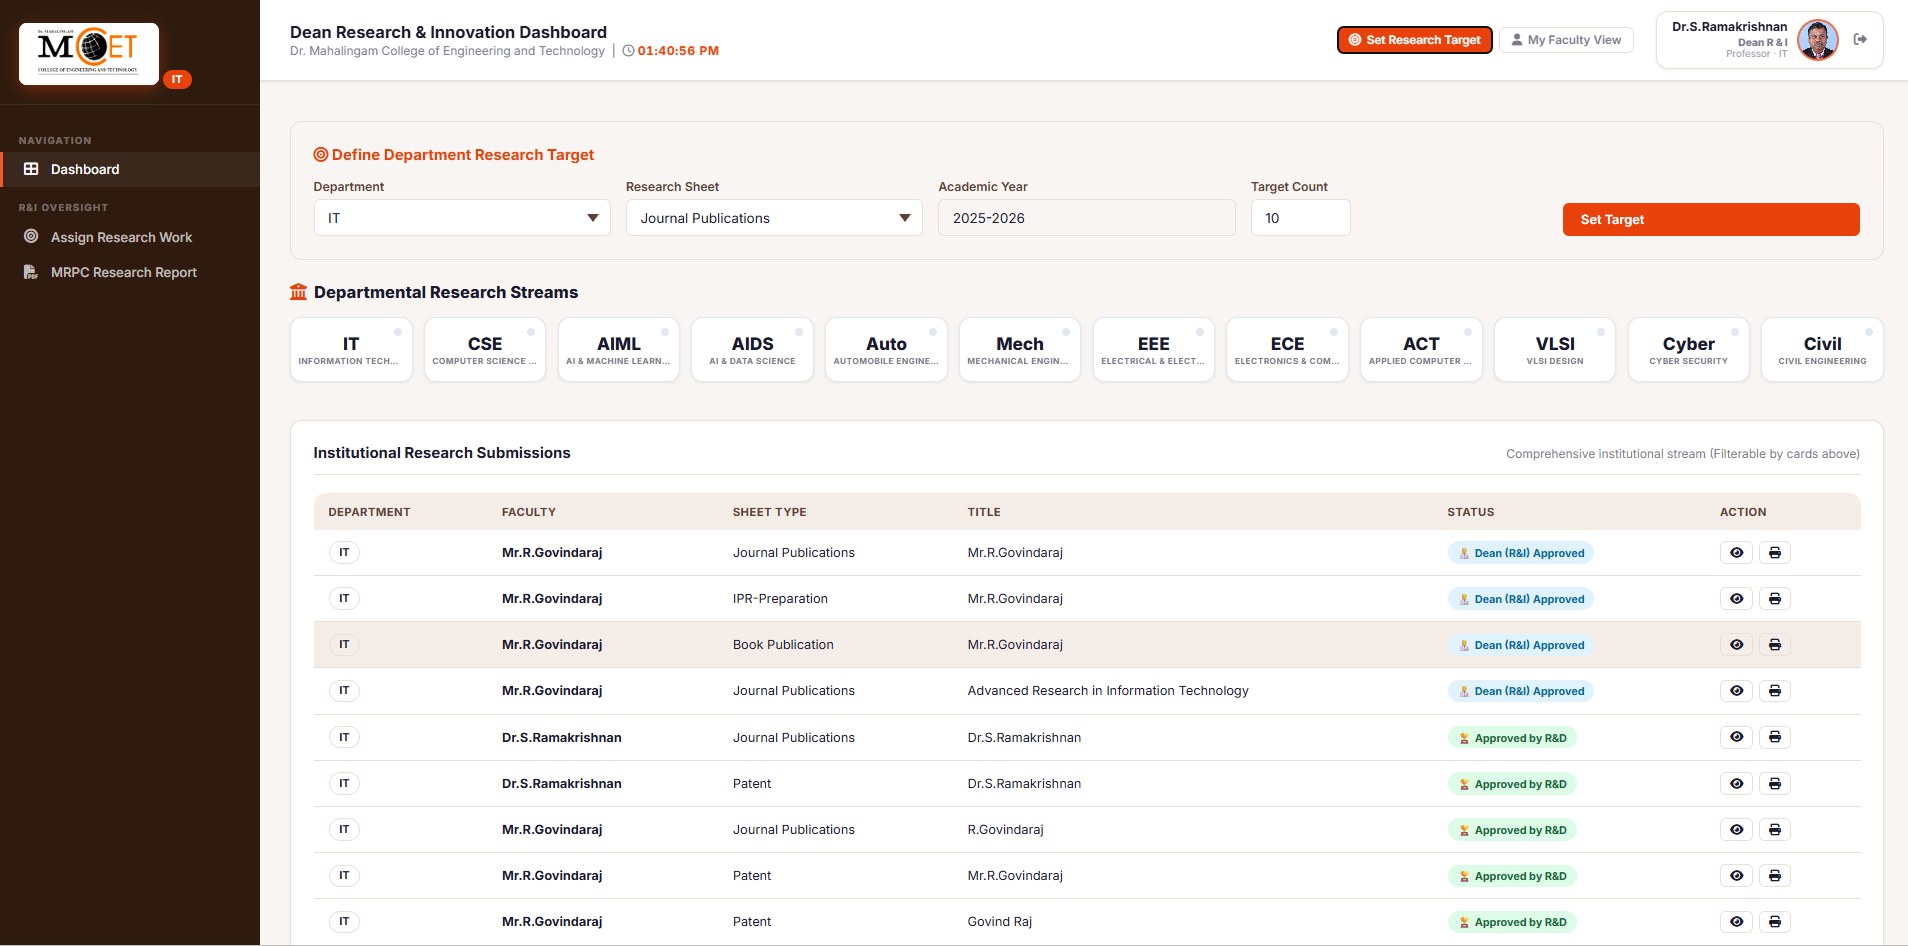
The Dean's landing screen answers the institutional questions first — how much research exists, where it came from, and what kind it is — before anyone opens a table.
1
2
3
4
5
- 1Outcome counters. Total studies, publications, IPR & patents and external funding, each with its own sub-label — approved studies, journals and chapters, published and granted, proposals and projects.
- 2Generate Full MRPC Report. The institutional report is produced from the dashboard itself, alongside Set Research Target and the faculty view switch.
- 3Inter-departmental research output. Volume of research items per department as a single comparable series.
- 4Research portfolio. A breakdown by activity type — journal, IPR, conference, funding, consultancy.
- 5Departmental research streams. All twelve departments as filter cards that drive the tables below.
06 Activity records
Keep research records organized and traceable.
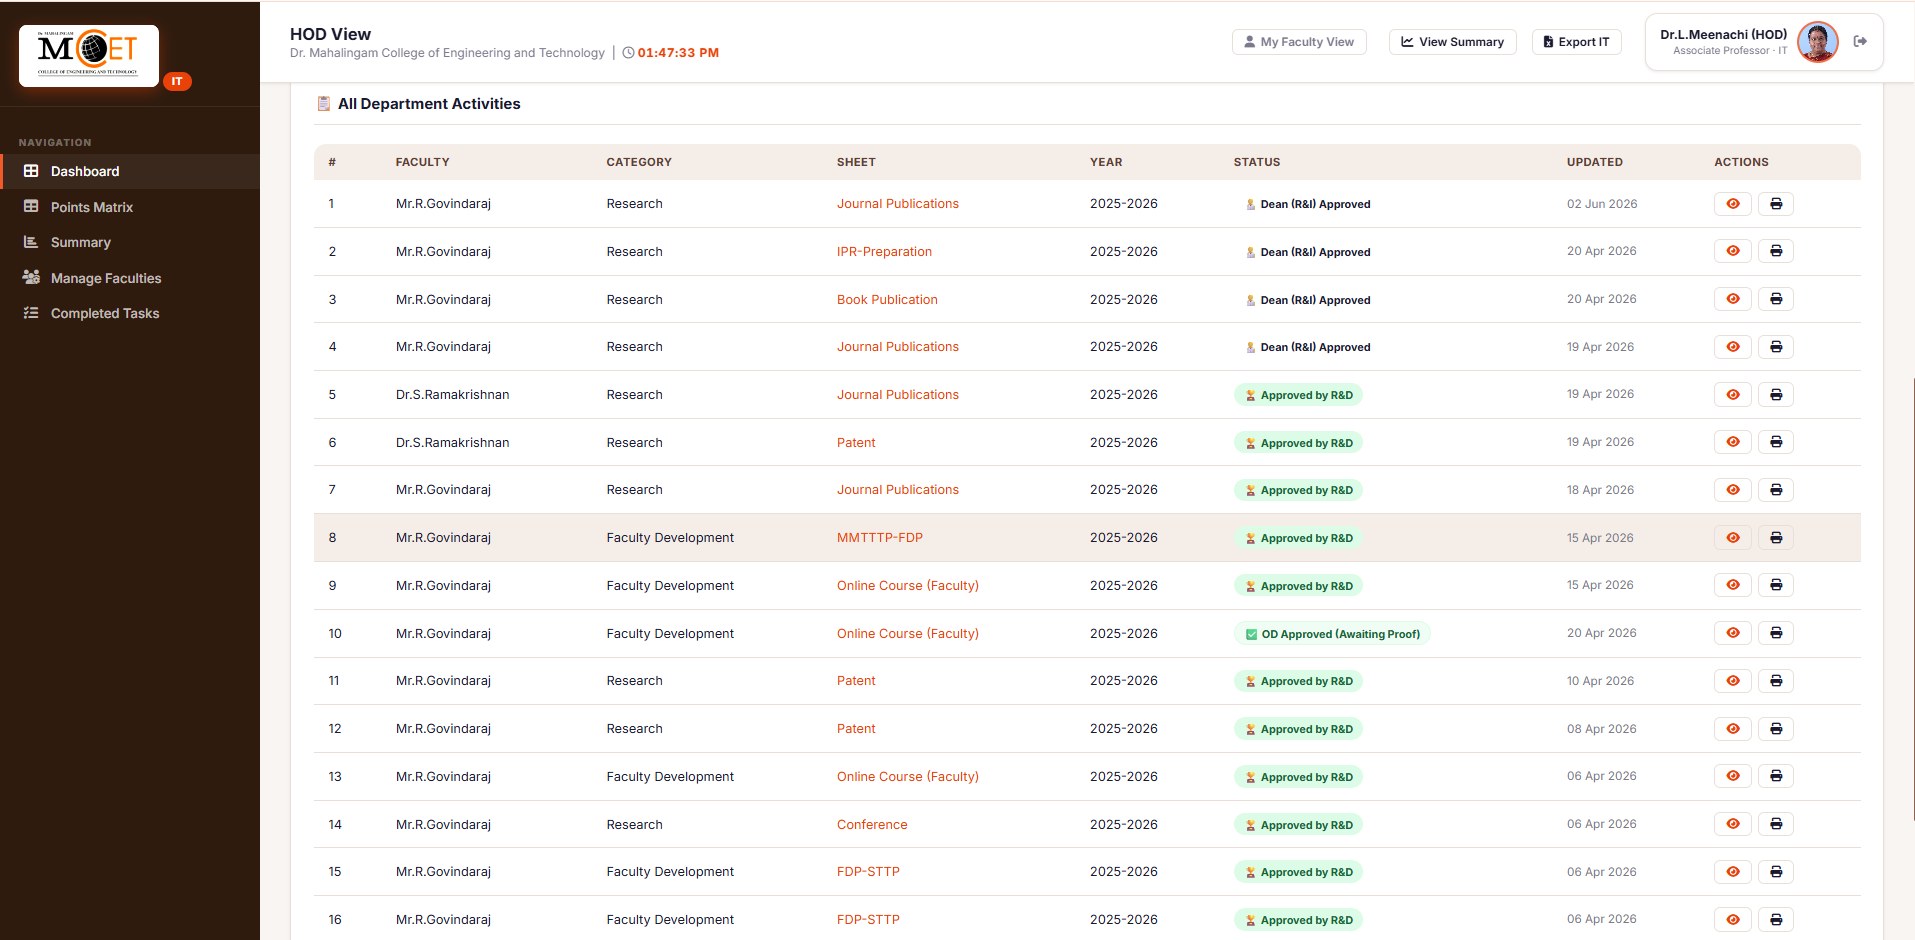
Research is recorded as activity sheets rather than free-form entries. The same row is readable at three levels — institution, department and individual — because there is only ever one row.
Eighteen activity sheets, one shape
Journal Publications, Book Publication, Conference, Patent, Research-Submitted, Research-Preparation, IPR-Preparation, Research Project, Research-Funding-Submitted, Consultancy (Project), Consultancy (Training), Consultancy-Planning, Students In-house Seed Money, Technology Transfer, Expert Certification, Skill Services, Conference Organization and PhD Completion. Each one is a defined sheet, which is what makes a single consolidation table possible later.
07 Research progress
Make progress measurable, not descriptive.
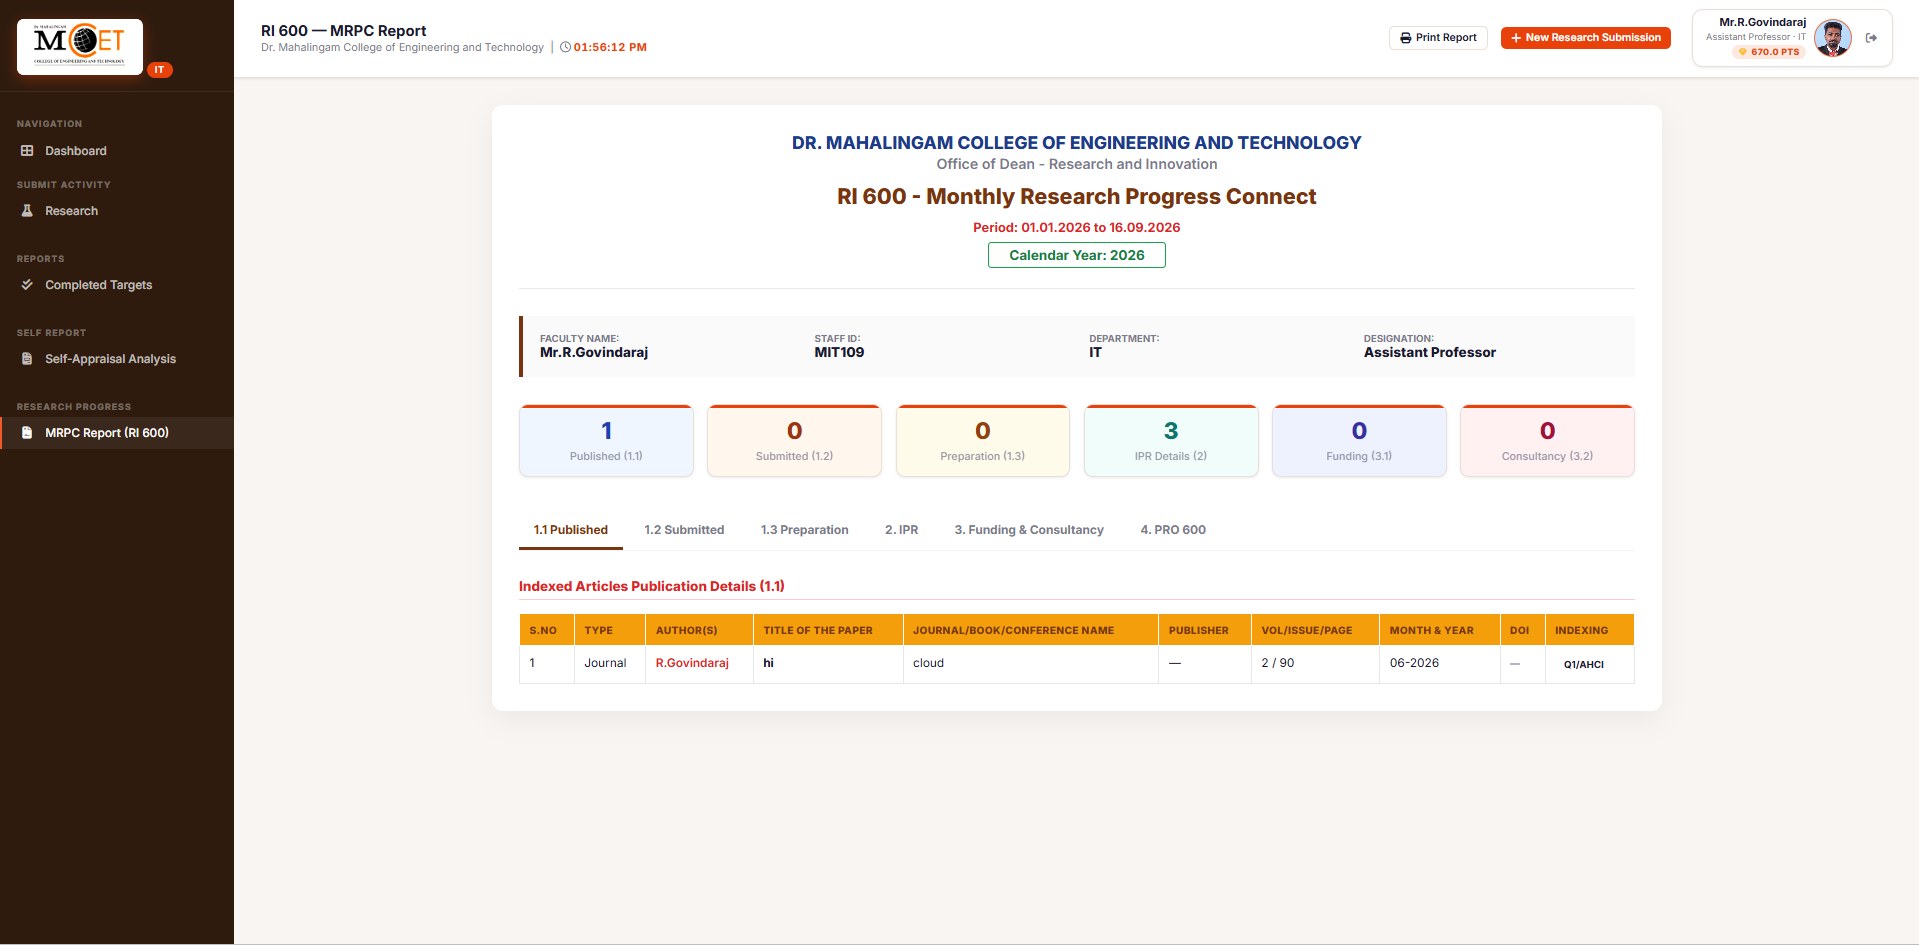
Progress in MRPC is a number a person can act on. A faculty member sees an achievement score and how far a target still has to go; the institution sees the same progress rolled up over a reporting period as the RI 600 report.
What the report holds
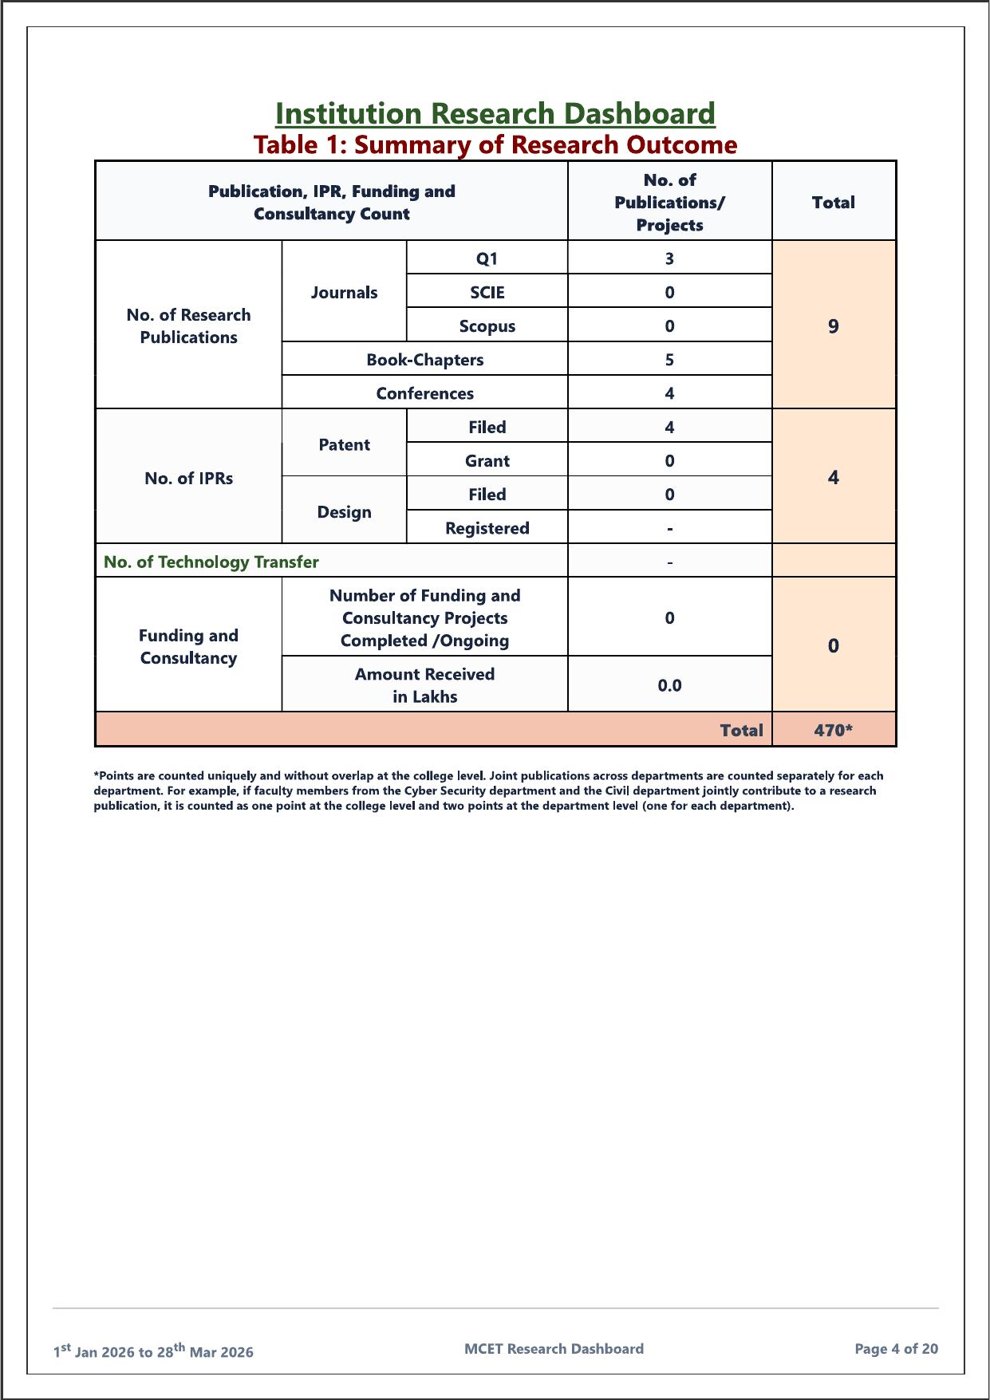
Six counters open the report — Published (1.1), Submitted (1.2), Preparation (1.3), IPR Details (2), Funding (3.1) and Consultancy (3.2) — and each one has a matching detail tab beneath, ending at PRO 600. Opening 1.1 lists indexed article details: type, authors, title, journal or conference name, publisher, volume and page, month and year, DOI and indexing.
- APeriodA stated date range within a calendar year.
- BProgressCounts per research category.
- CActivityThe individual records behind each count.
- DStatusOnly verified records reach the report.
- EReviewPrinted, or carried up into the institutional report.
08 Targets & assignment
Turn research expectations into trackable work.
A target in MRPC is not a statement of intent — it is a record with an owner, a count and a progress bar that moves as approved activities arrive.
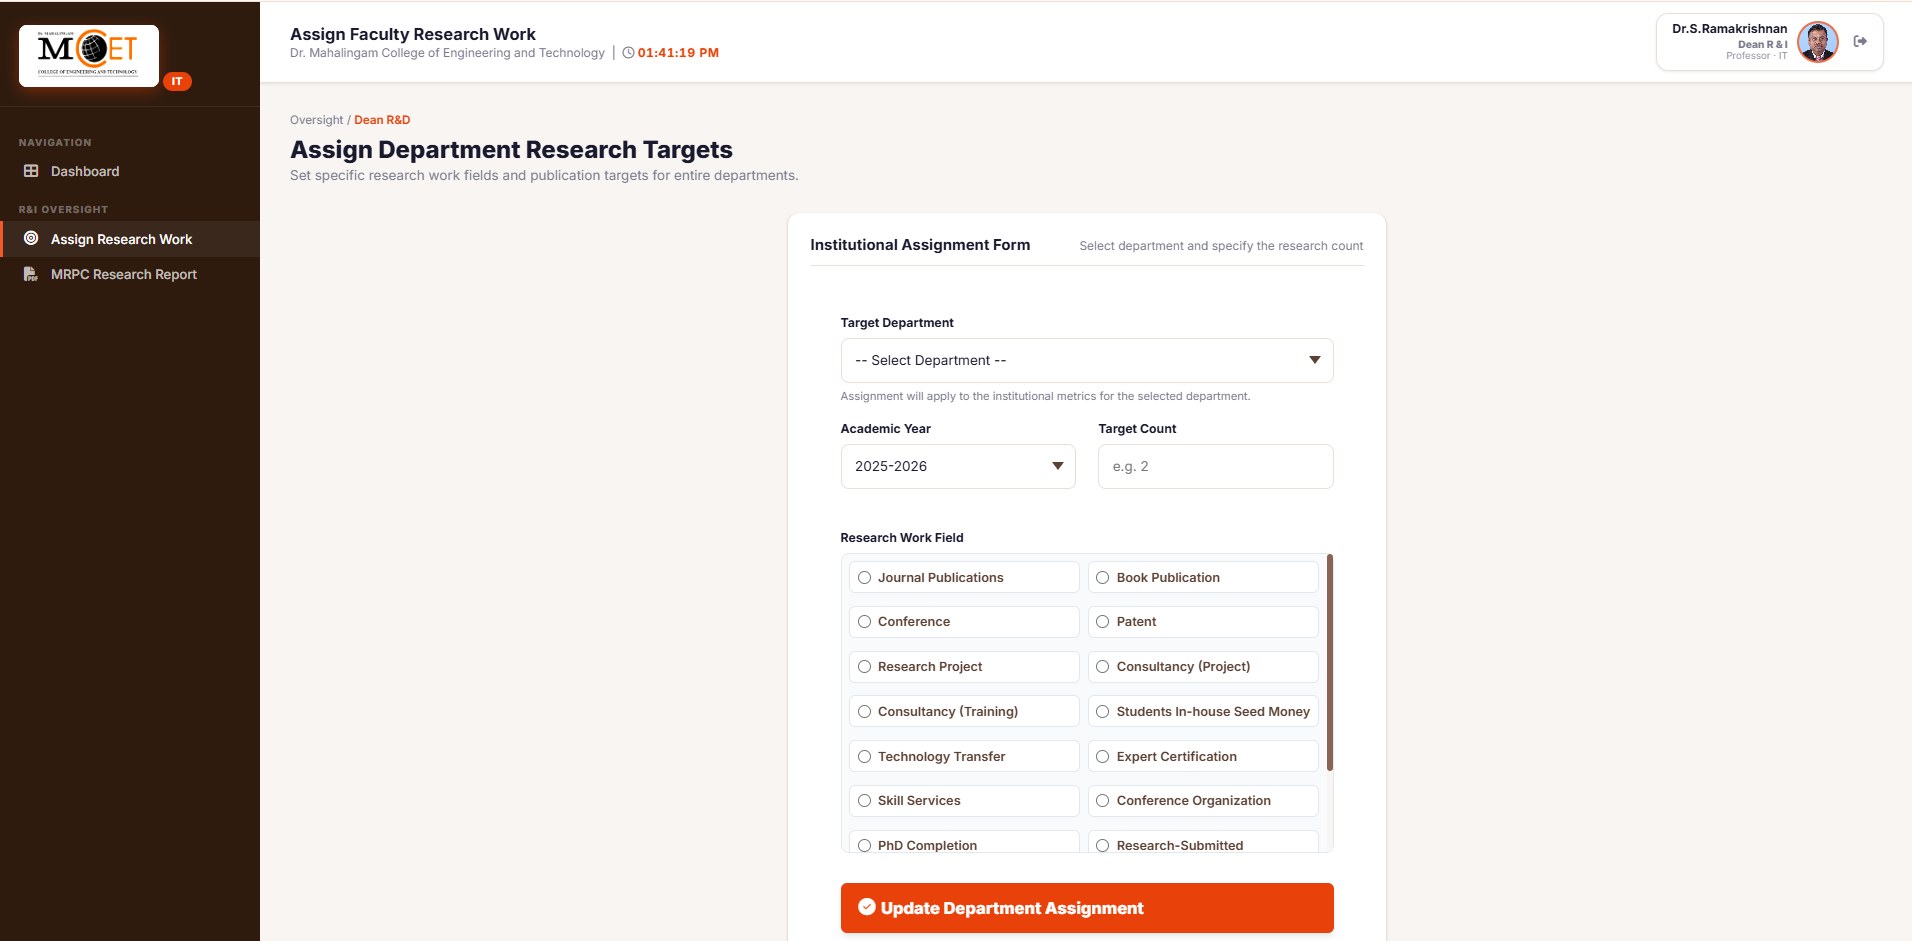
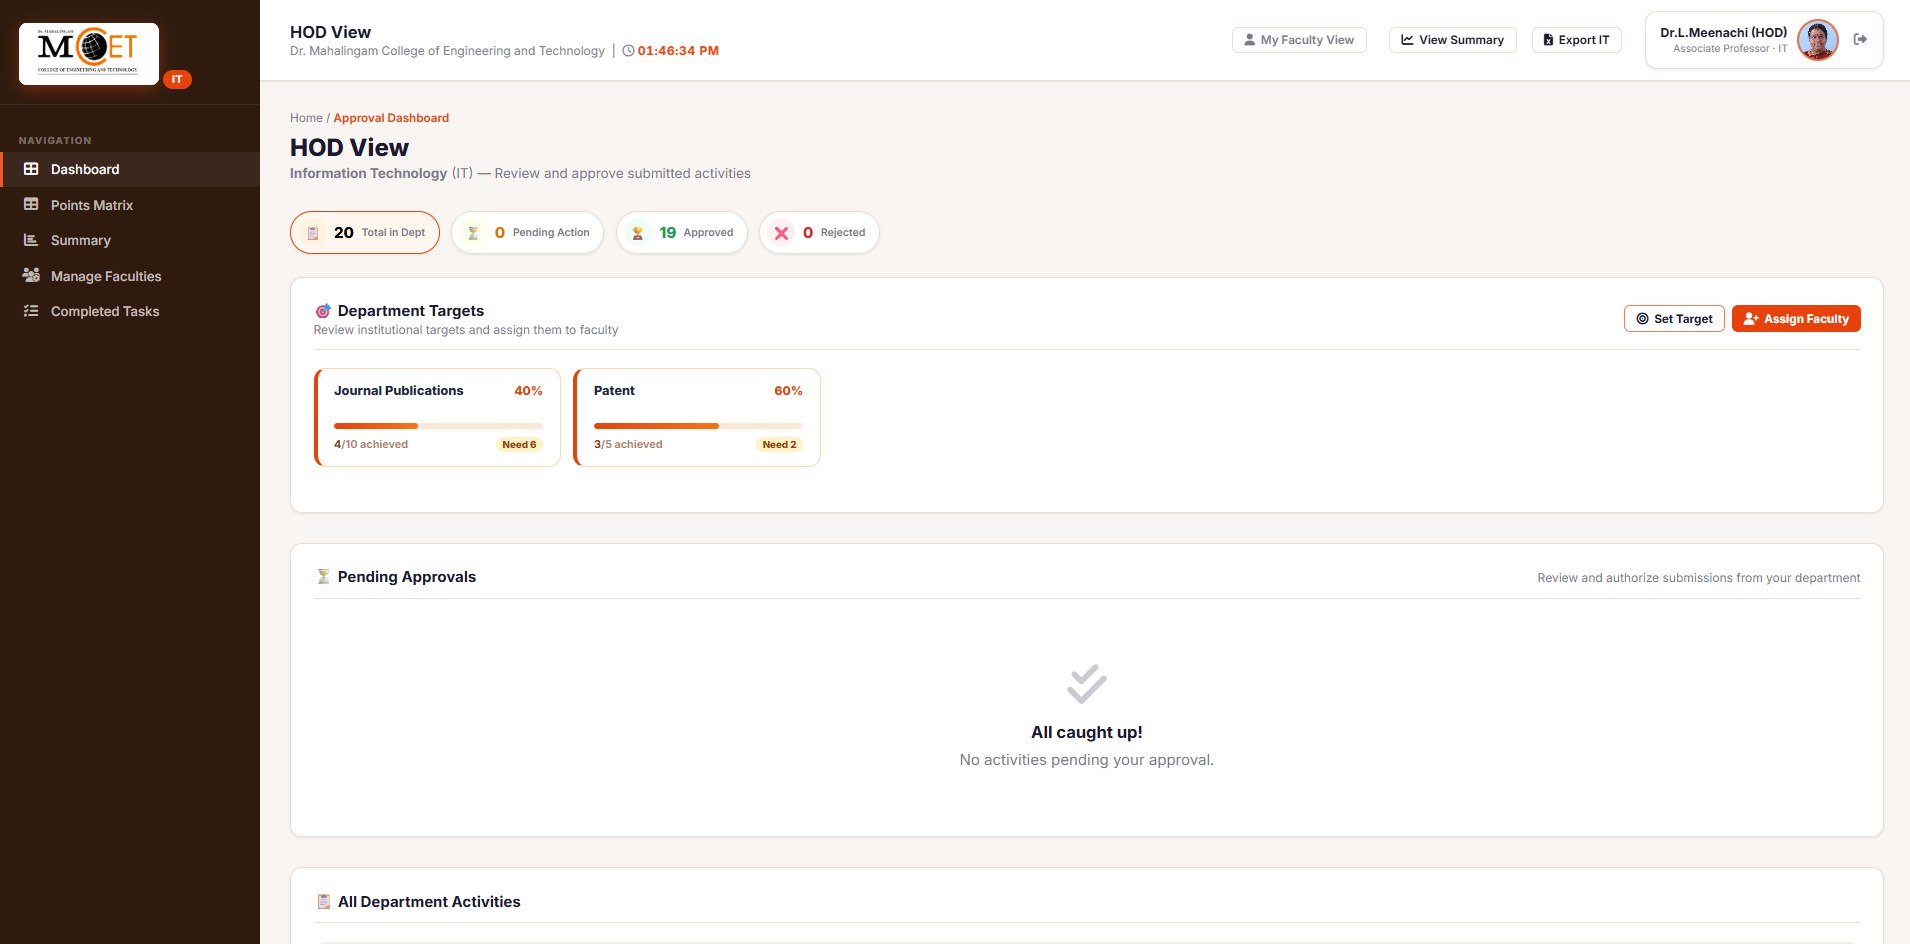
The same target appears on the faculty dashboard as My Targets, marked as auto-updating and showing pending and completed targets together. Nothing is re-entered between the three levels.
09 Faculty experience
Give faculty a clear view of their own research activity.
For a faculty member, MRPC is four things: what I have been asked to do, what I have submitted, where each submission stands, and what it adds up to.
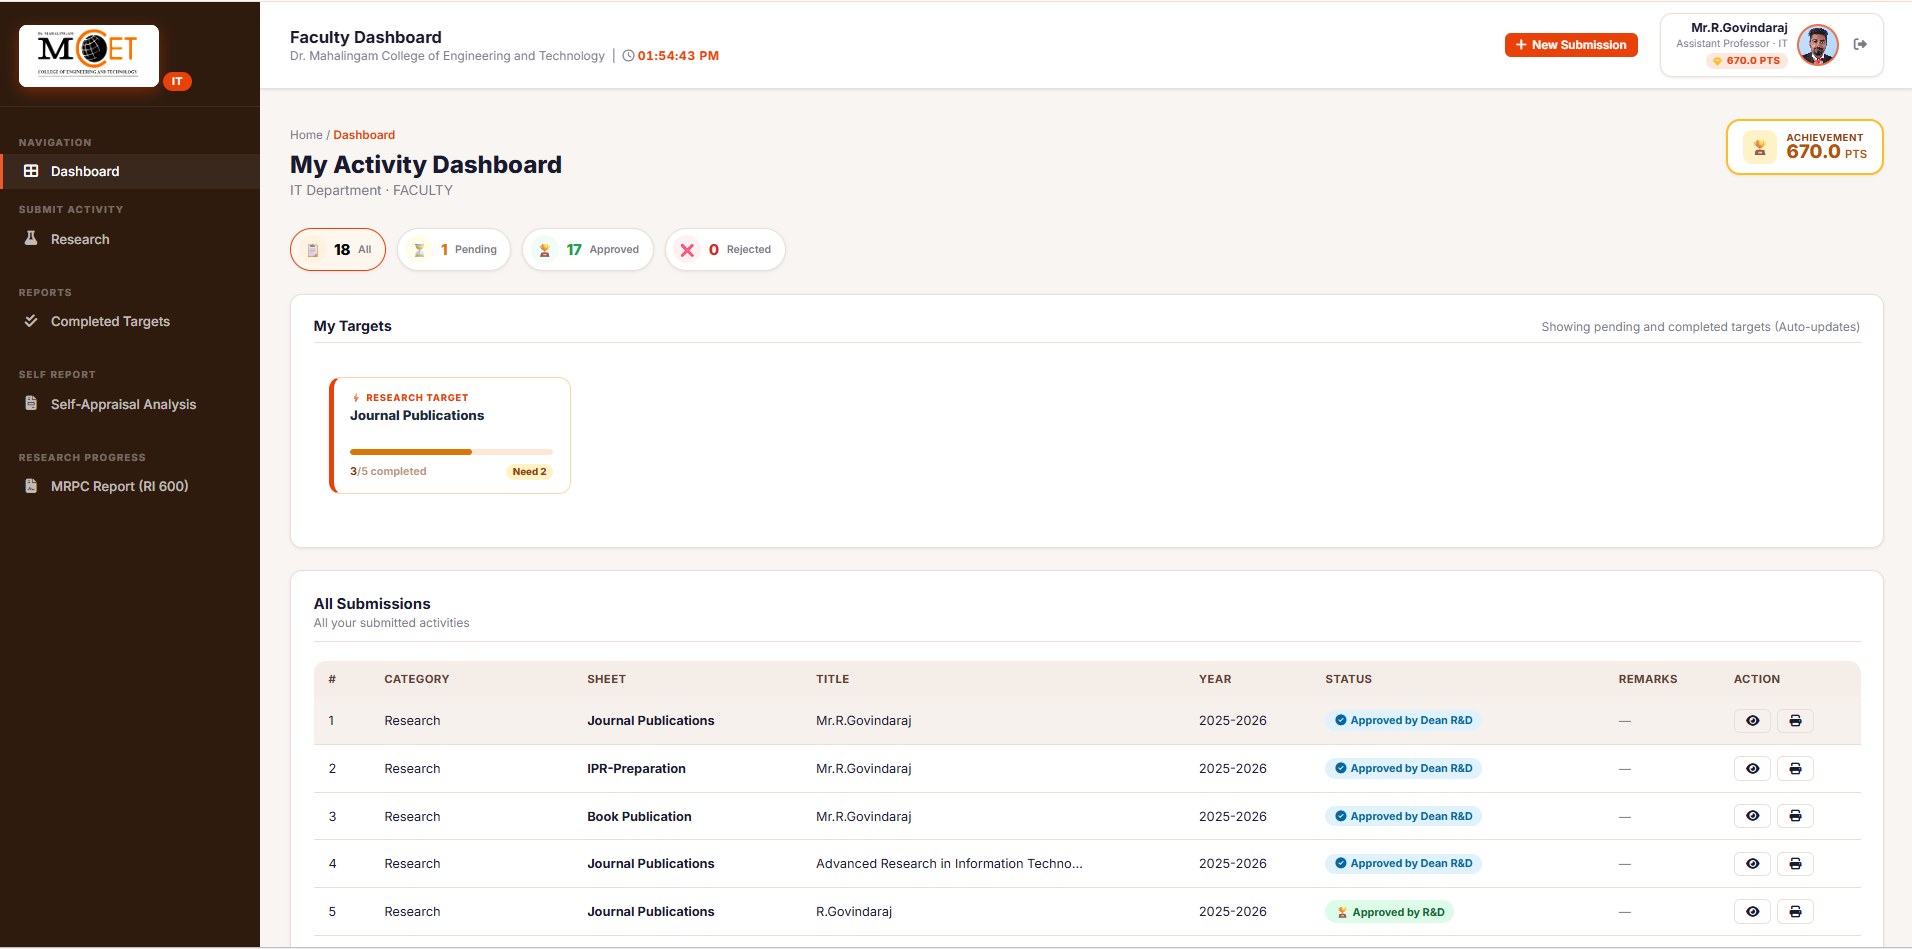
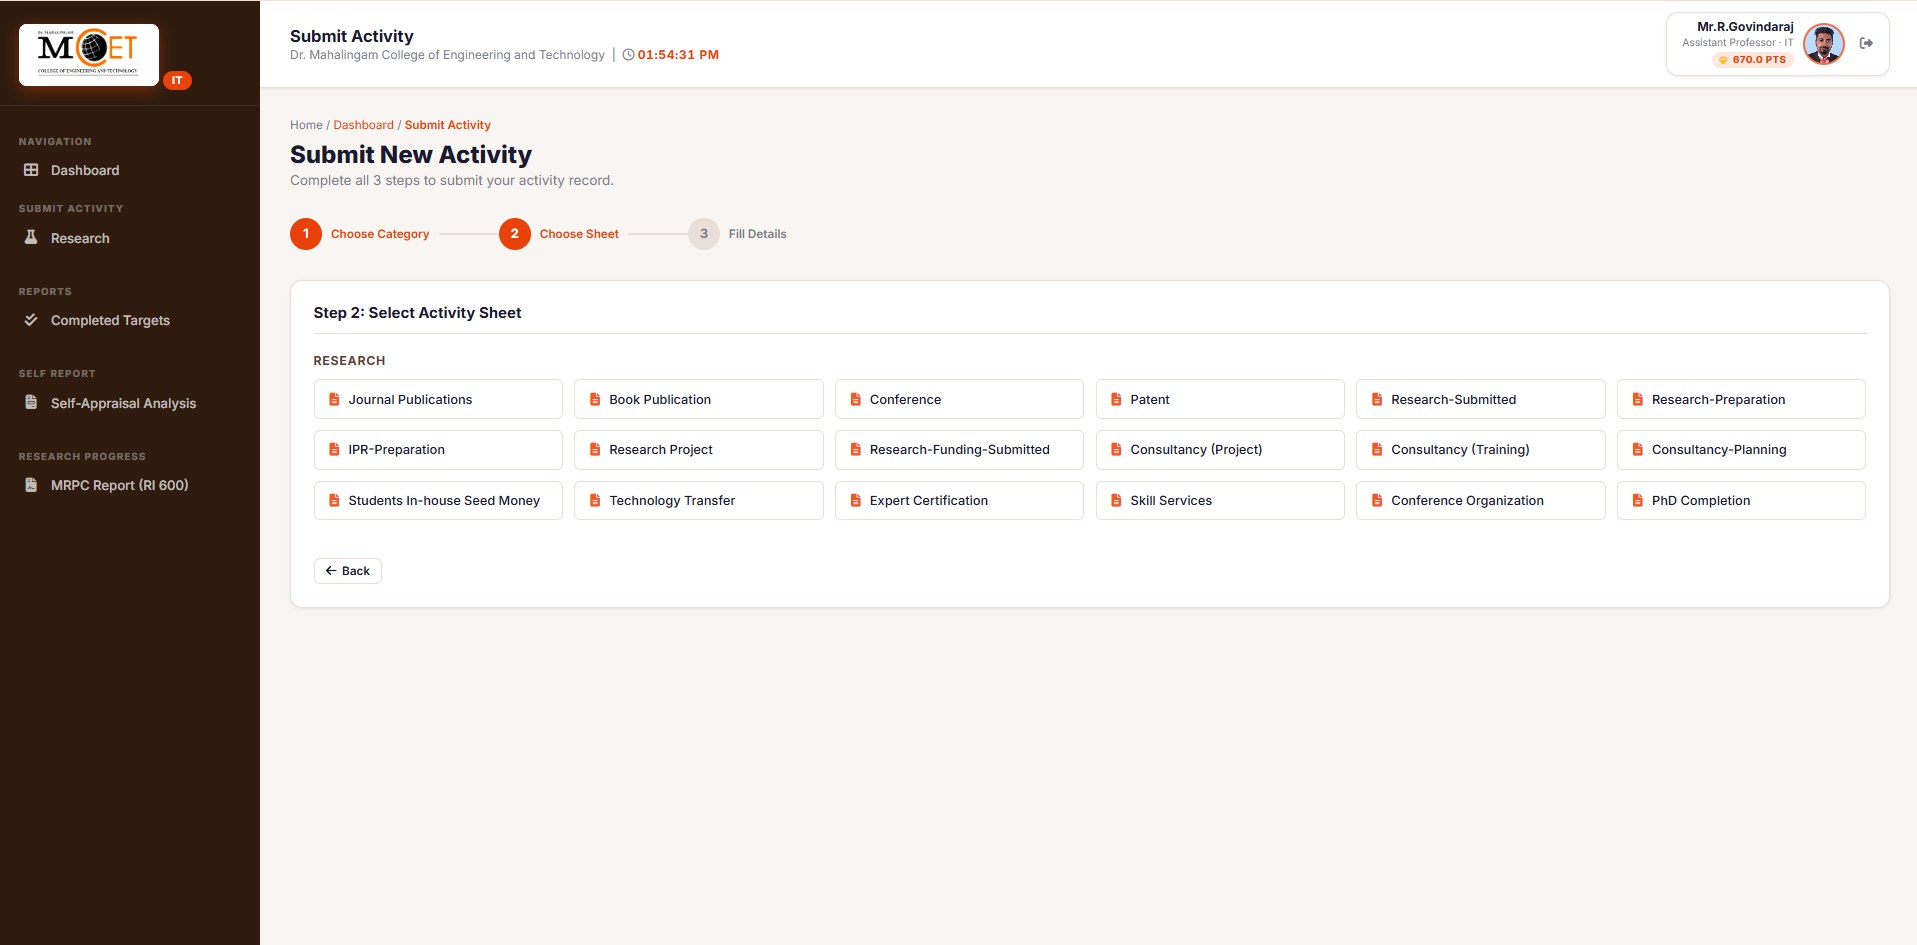
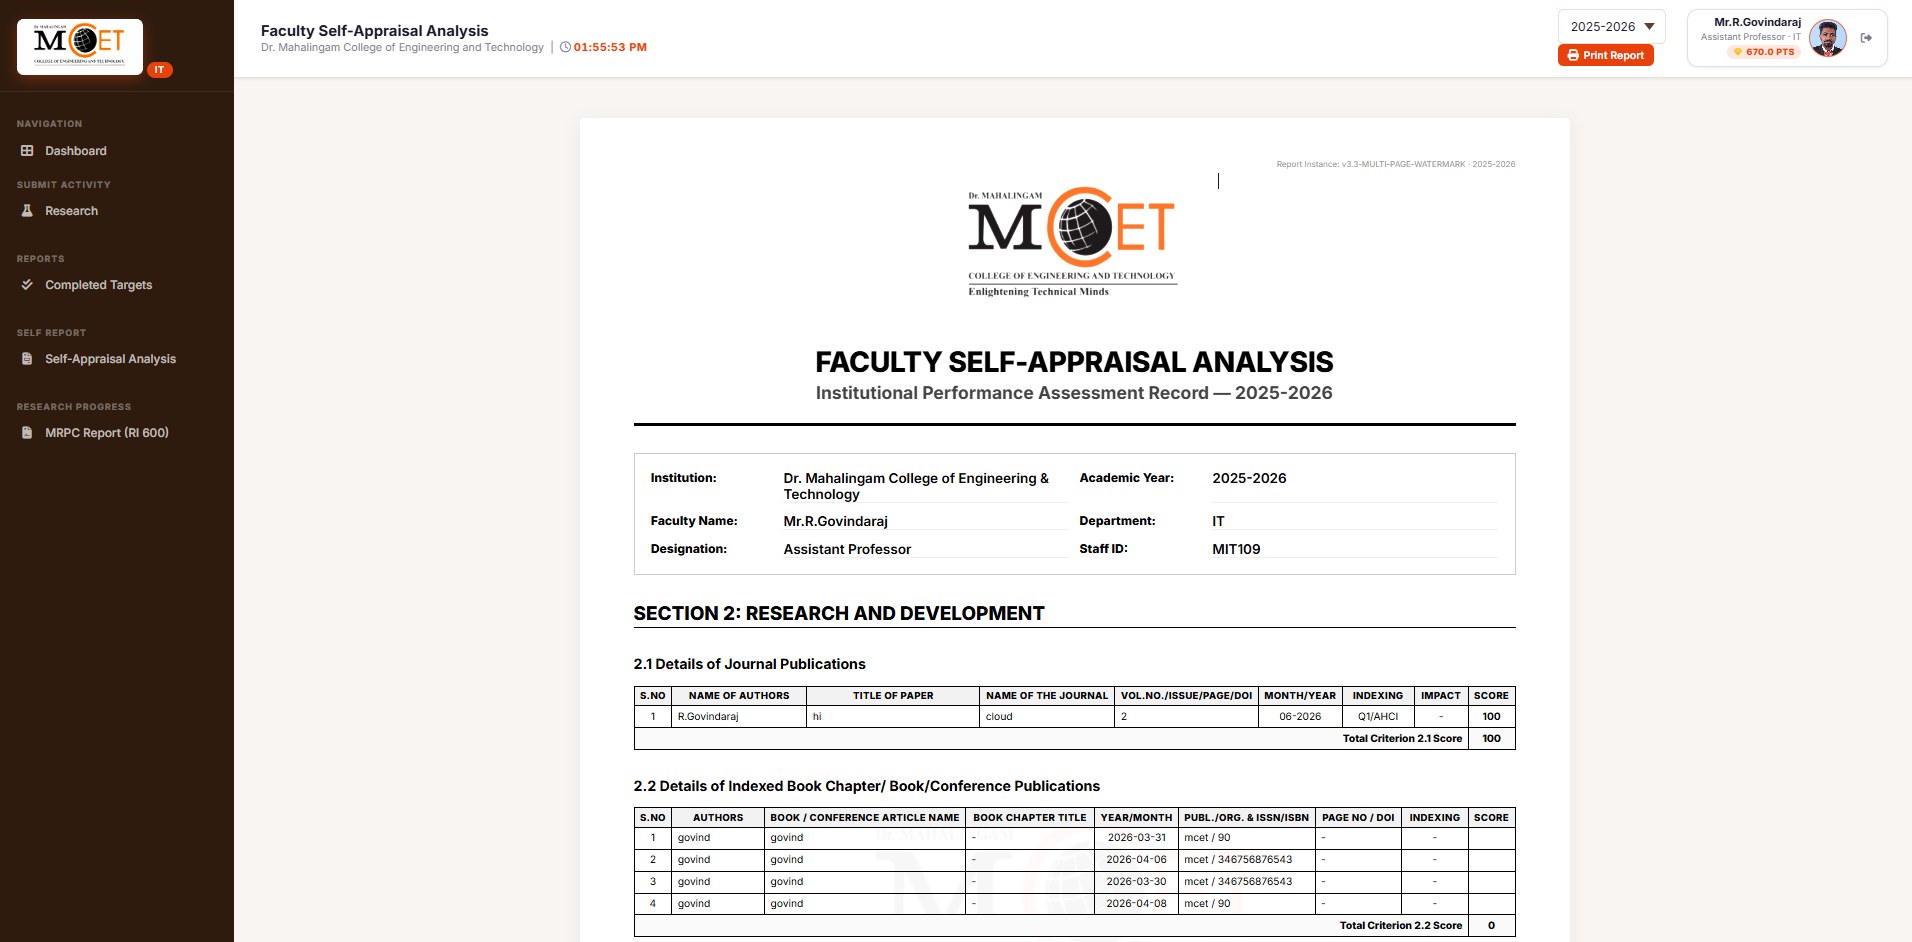
The faculty sidebar keeps these apart deliberately: Submit activity, Reports for completed targets, Self report for the appraisal, and Research progress for the RI 600 report. A submission is one action; everything else is reading.
10 Department & institution monitoring
Visibility at the level where decisions happen.
HOD and SPOC views open on the same question — what is waiting on me — and then let the reviewer widen out to the whole department without changing screens.
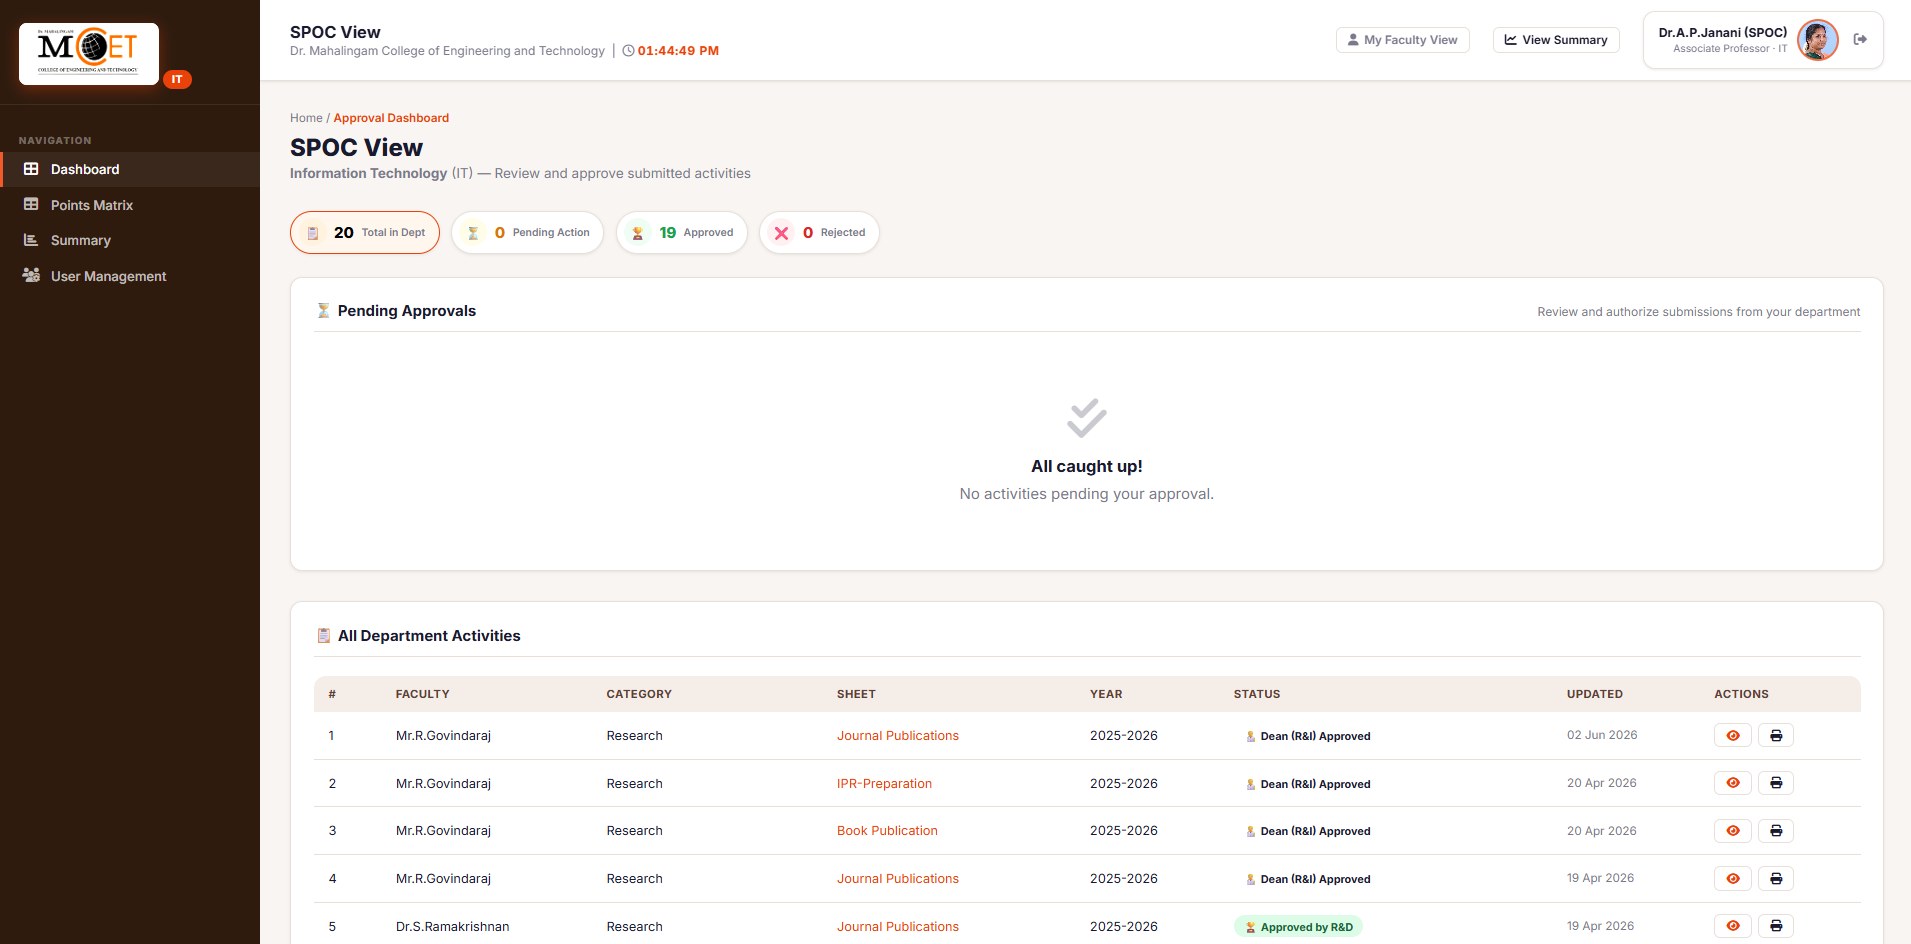
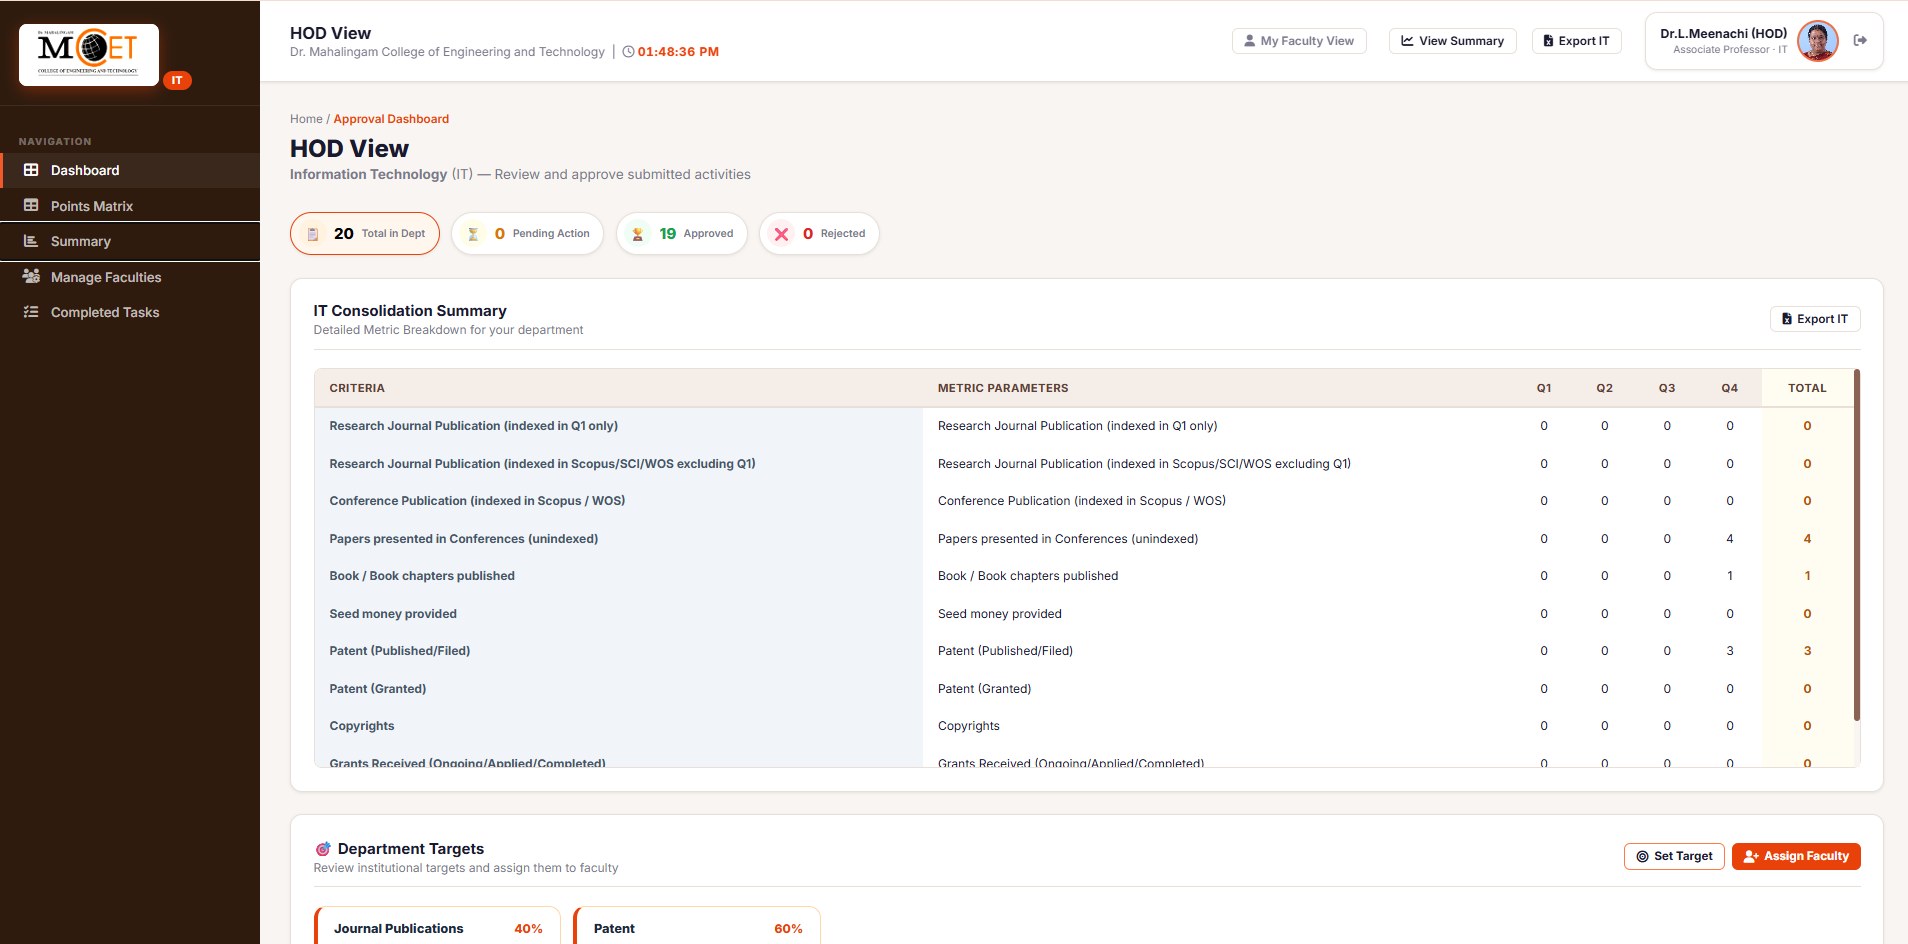
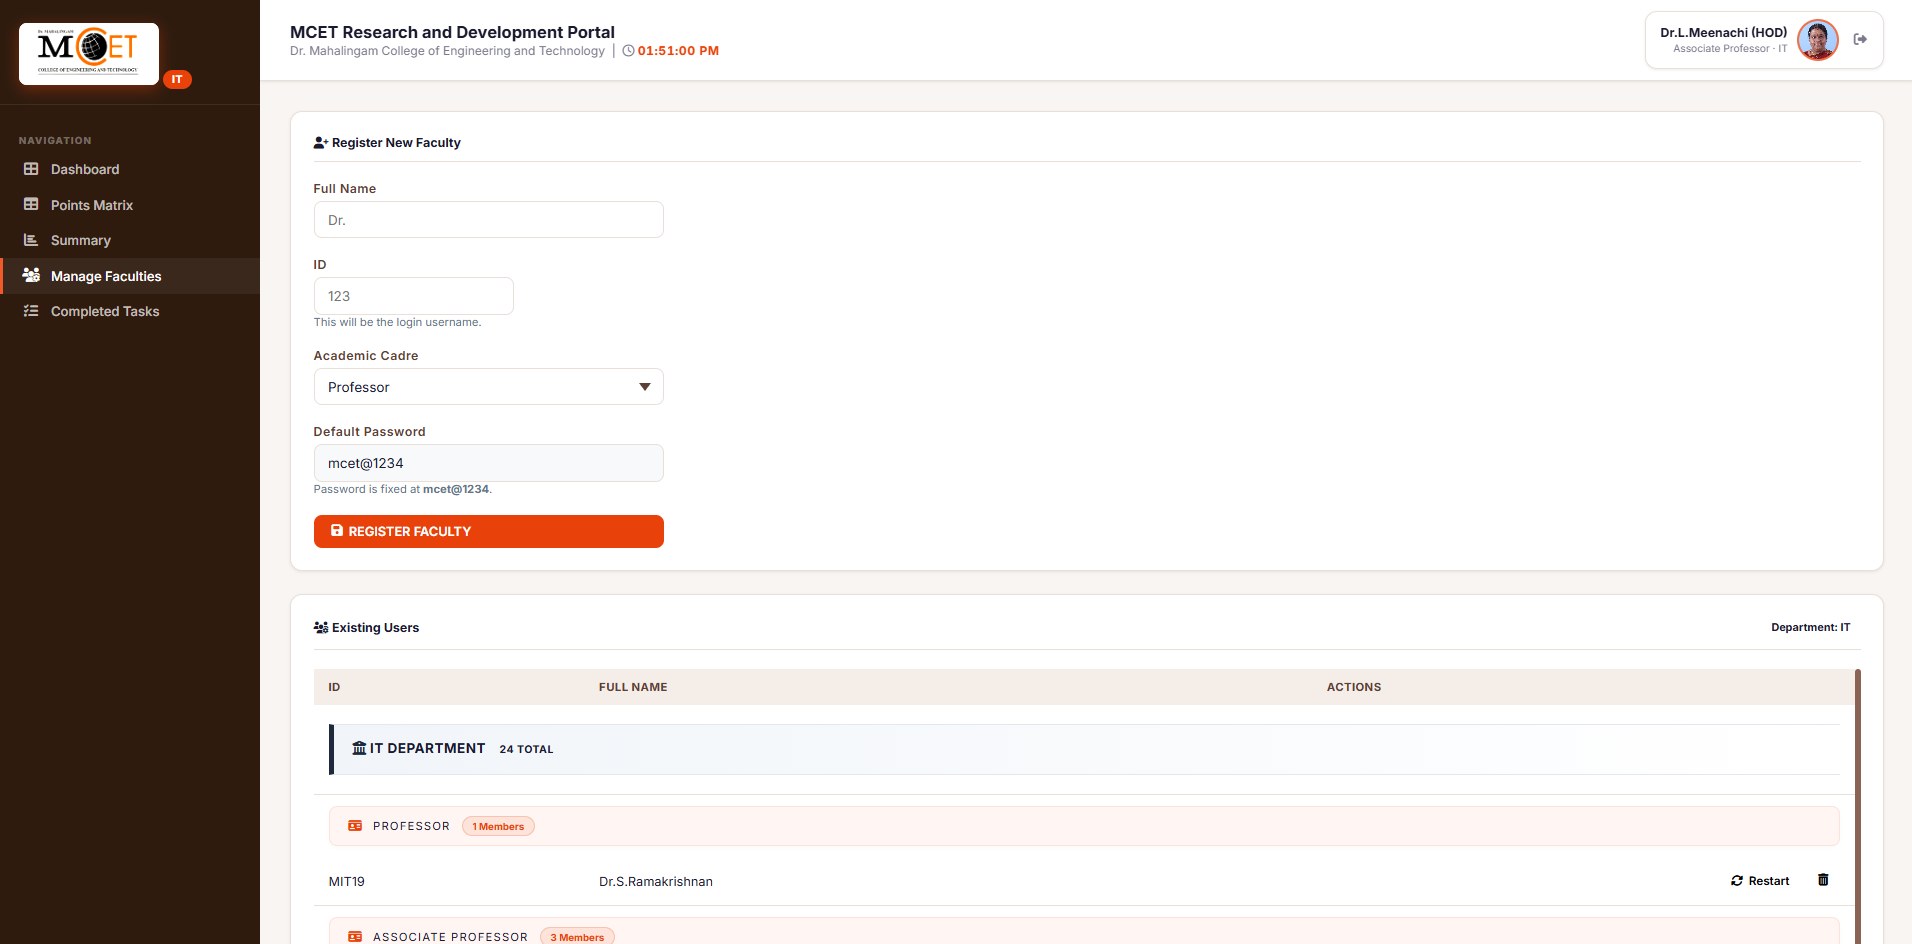
Status labels visible on records include Approved by R&D Dean (R&I) Approved OD Approved (Awaiting Proof) — a record carries where it has reached, not just whether it is done.
11 Reports & analytics
Turn recorded progress into a document the institution can use.
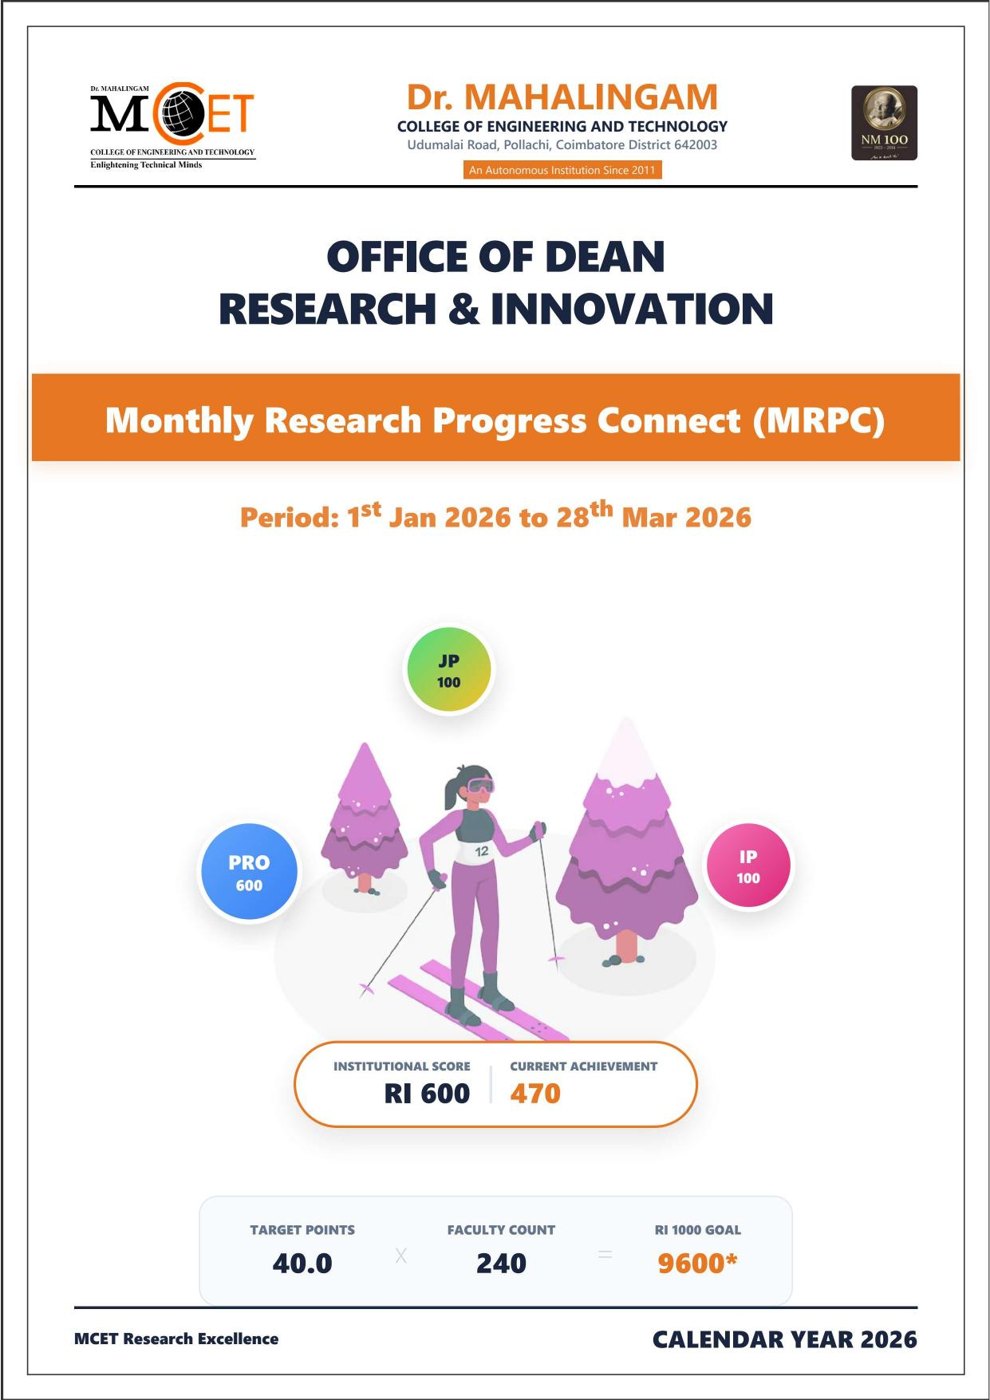
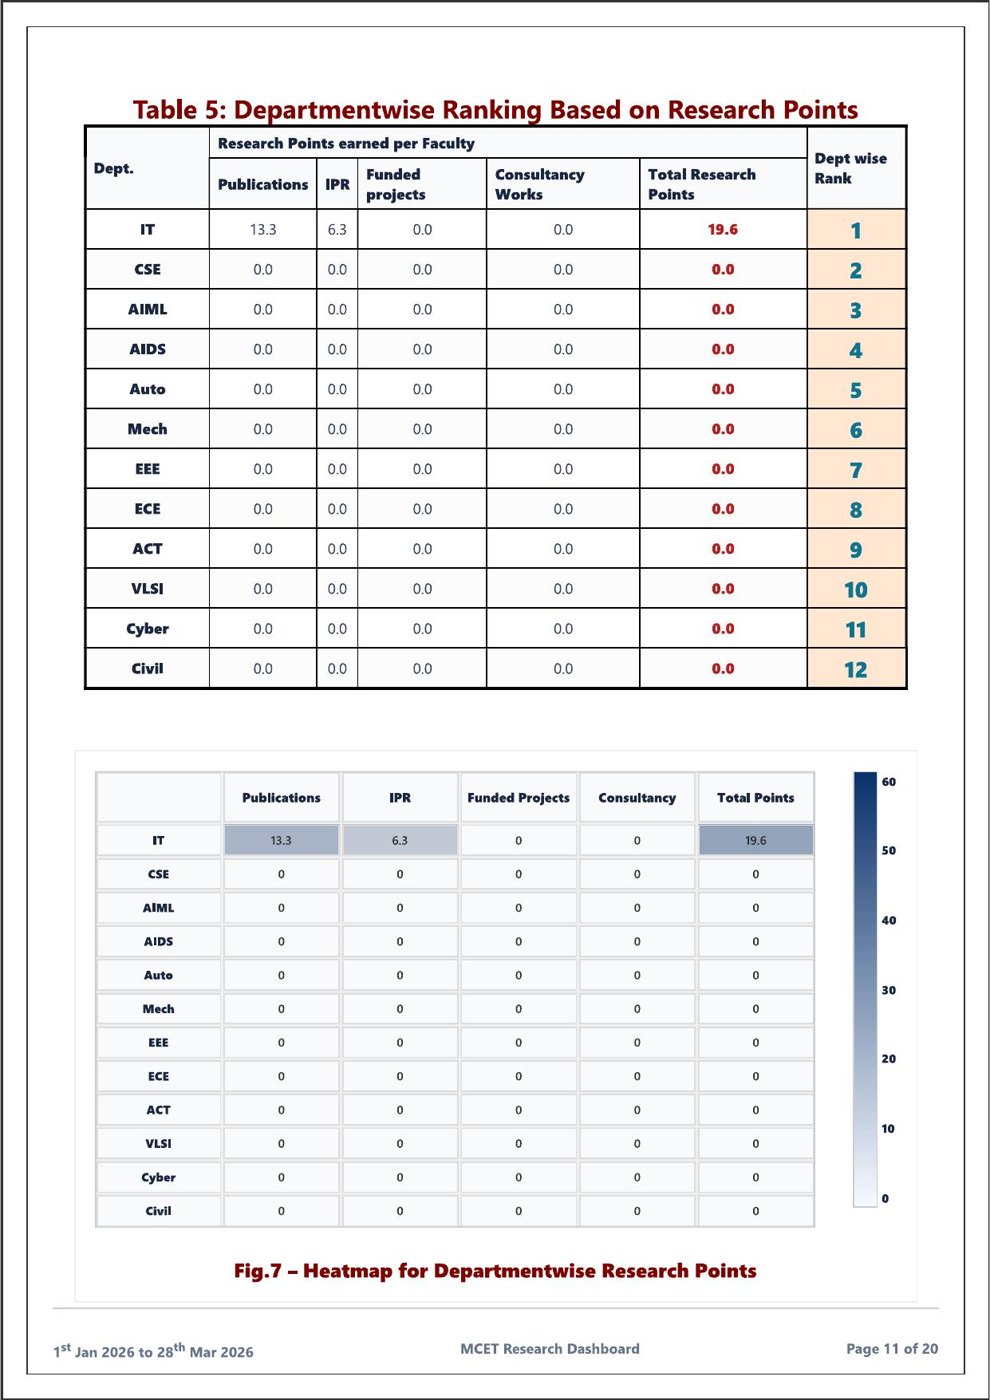
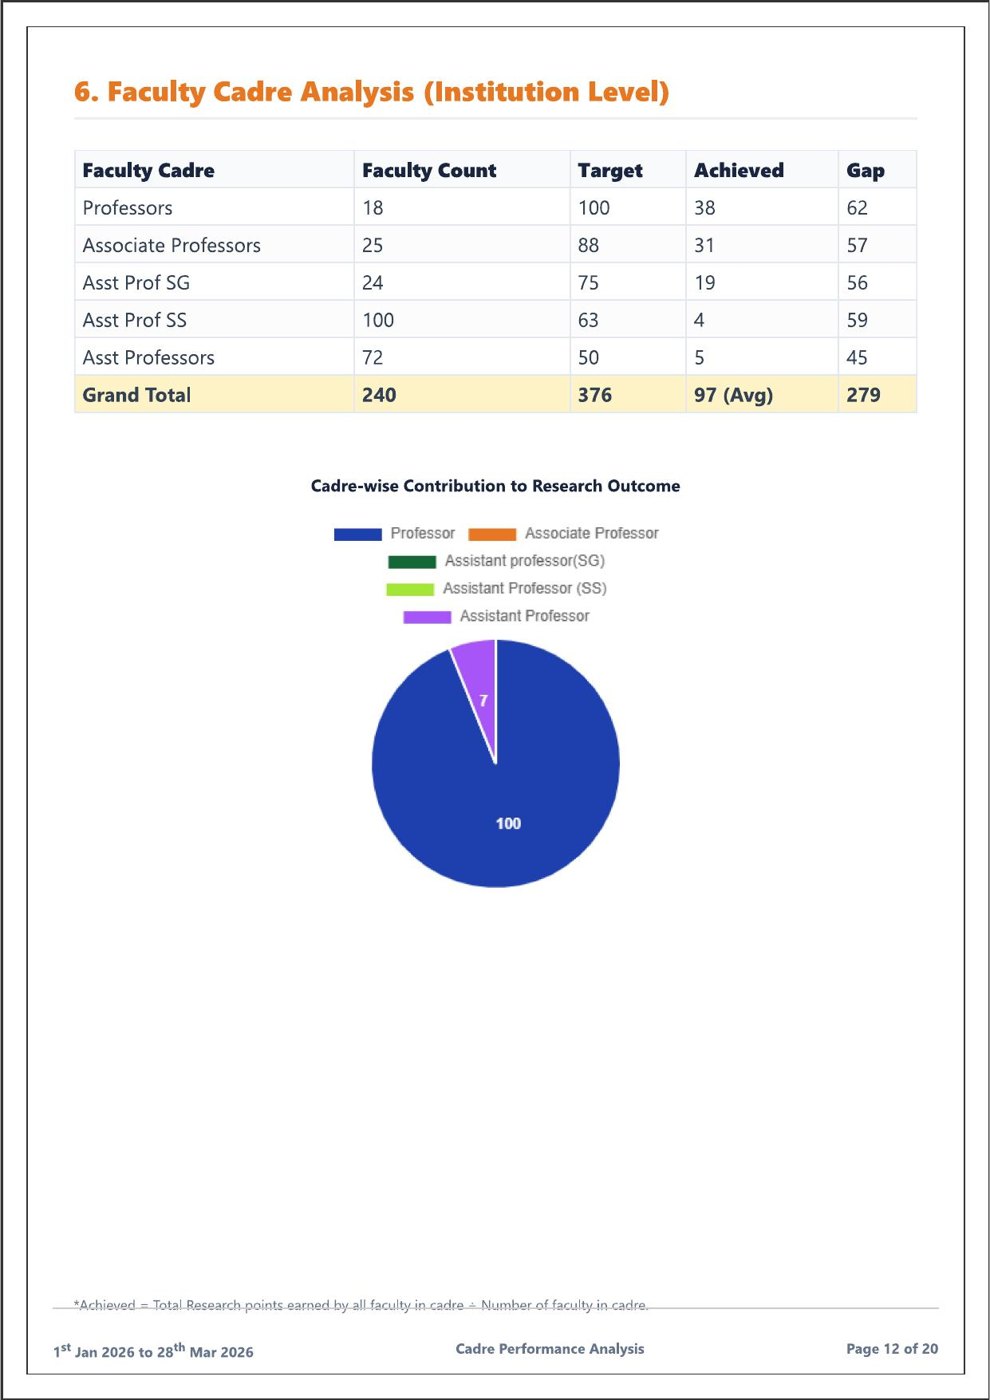
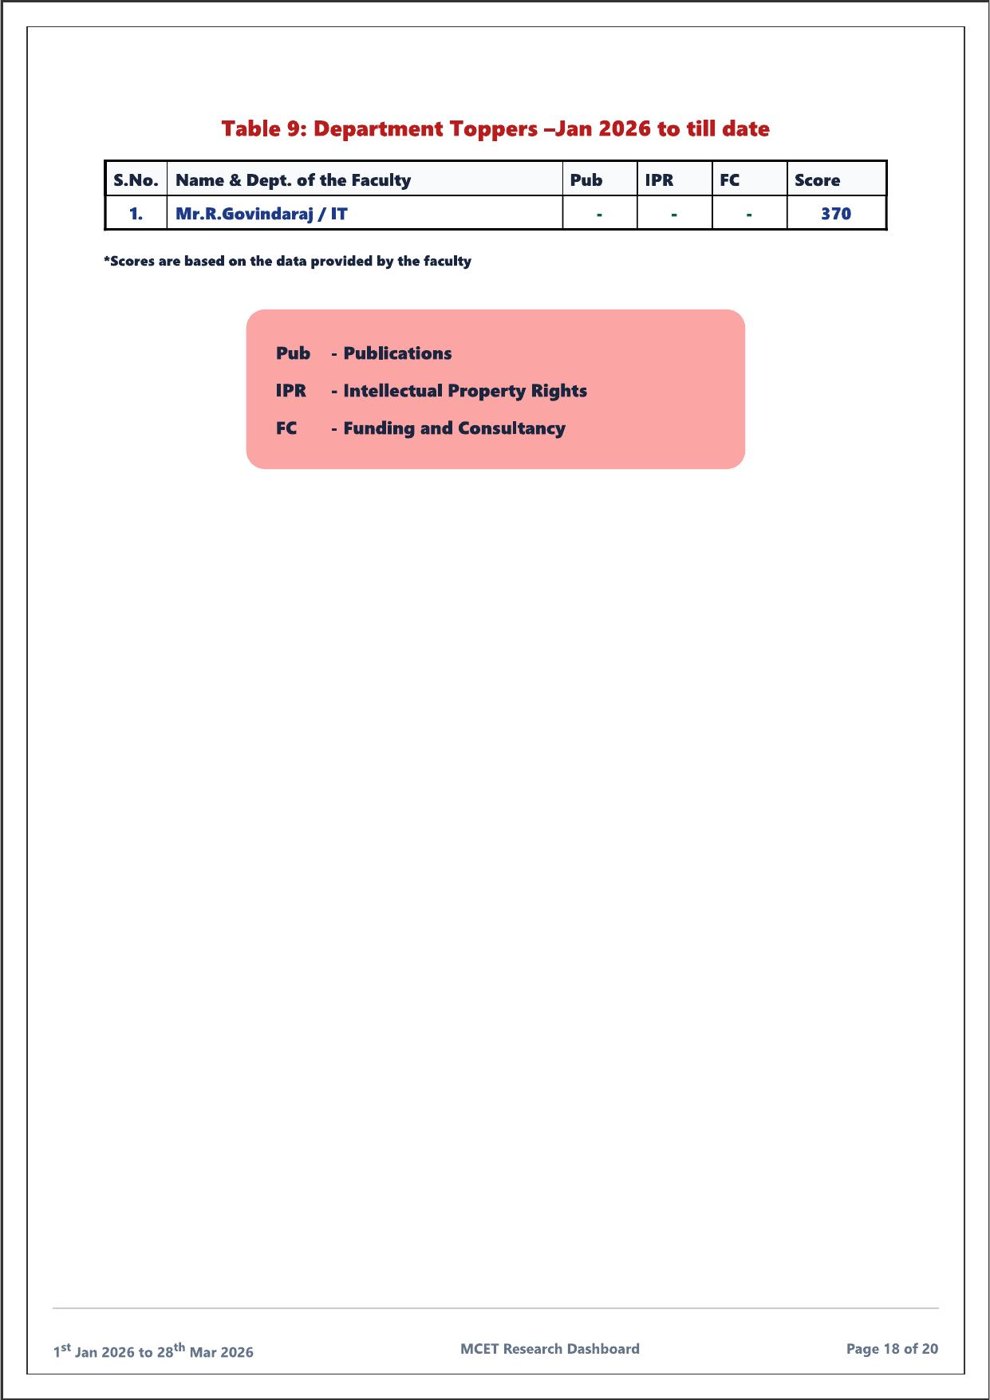
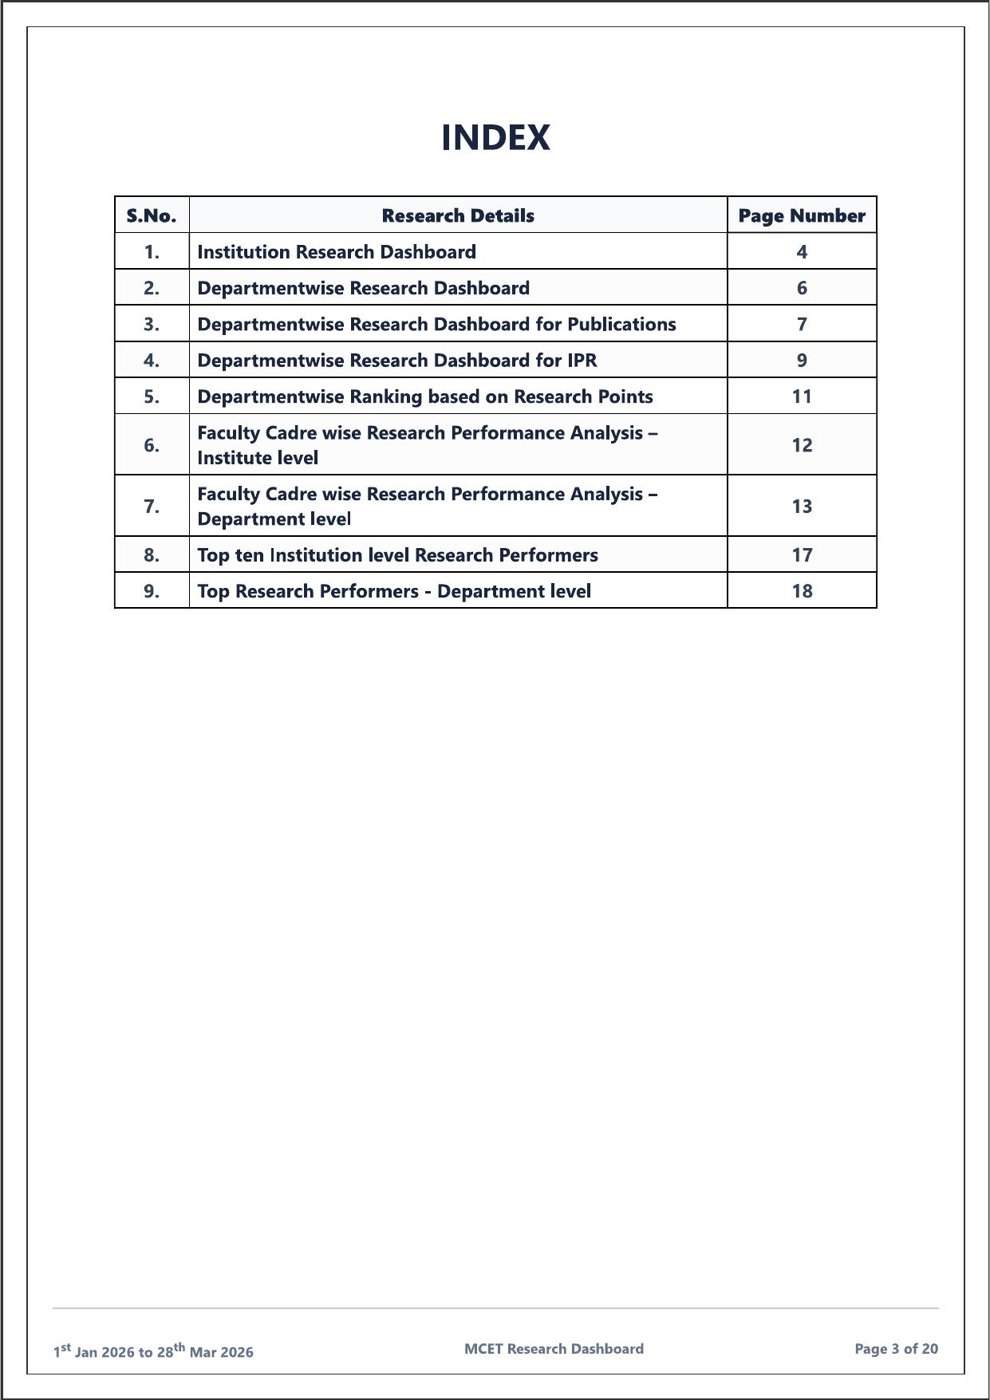
Generate Full MRPC Report produces a complete institutional research document from the same records the dashboards read. Below are pages from a report generated by the live system for a 2026 reporting period.
12 Screen flows
Screen by screen, for each role.
The path each user takes after login. Pick a role, then a step, to see the screen it lands on.
Where the paths meet
The four flows are one flow seen from four seats. A record created in Submit New Activity appears in the SPOC's All Department Activities, in the HOD's Pending Approvals and consolidation summary, and in the Dean's Institutional Research Submissions — the same row, gaining a status rather than a copy.
13 Interface gallery
Inside MRPC.
Every screen shown here is from the live application. Select any image for full-screen view; arrow keys move between them.
14 Design system
The system read back from the product.
MRPC uses one warm palette throughout: a deep brown navigation rail, a single orange for every primary action, and white surfaces on a warm off-white page. Status is the only place additional colour is allowed in.
Status badges
Pill badges carry the review state on every row.
Actions
One solid orange button per screen region; secondary actions stay outlined.
Forms & tables
Stacked label-over-field forms; tables with a tinted header row and per-row view and print actions.
15 Impact
A clearer operating layer for research progress.
What changes is where the work lives, and who can see it without asking.
- 01Centralized research informationPublications, IPR, funding and consultancy in one record set rather than per-person files.
- 02Structured progress trackingProgress is a count against a target, visible to the faculty member and the department at the same time.
- 03Better activity visibilityEighteen defined activity sheets instead of free-form entries.
- 04Easier monitoringPending, approved and rejected are counters on a dashboard, not a question to ask.
- 05Clearer departmental viewCriterion-wise consolidation across quarters, per department, ready to export.
- 06Transparent pointsA published matrix and a stated sharing rule, readable by everyone involved.
- 07Reporting readinessInstitutional, departmental and individual reports generated from verified records.
Research progress, connected.
MRPC brings monthly research progress, project information, activities and monitoring into a single digital workspace.
MONTHLY RESEARCH PROGRESS CONNECT
MRPC
Dr. Mahalingam College of Engineering and Technology